What is Bubble Plot?
Bubble plot is a scatter chart having x ,y coordinates and third dimension as size of bubble. To plot bubble chart in python, use plt.scatter() function of matplotlib library.
In this article, I will explain how to plot bubble chart in python using matplotlib package and seaborn package.
Installation of Packages
We will need numpy, matplotlib, seaborn and pandas packages to plot bubble chart in python. If you don’t have these packages installed on your system, install it using below commands.
pip install numpy
pip install matplotlib
pip install seaborn
pip install pandas
How to Plot Bubble Chart in Python
Bubble plot requires three numeric datasets to plot chart.
Let’s see an example to plot bubble chart using seaborn library dataset as input to chart in python.
Installation of Packages
We will need matplotlib and seaborn packages to show bubble plot. Install packages using below command.
pip install matplotlib
pip install seaborn
Import libraries
Import seaborn and matplotlib libraries in our python bubble plot code to get started with plotting bubble graph.
import seaborn as sns
import matplotlib.pyplot as plt
Prepare dataset
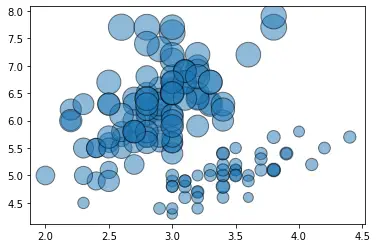
Seaborn library has inbuilt datasets. We will use iris dataset as input to bubble chart.
- Load iris dataset using load_dataset
- x variable stores sepal_width column values
- y variable store sepal_length column values
- z variable stores petal_length column values
# Create Dataset for bubble chart

df=sns.load_dataset('iris')

x=df['sepal_width']
y=df['sepal_length']
z=df['petal_length']
Plot Bubble chart using scatter()
Use plt.scatter() function of matplotlib module to draw bubble plot.
- The first argument x defines the x values for chart
- The second argument y defines the y values for bubble chart
- The third argument s defines scatter plot with bubble size
- The fourth argument alpha defines transparency to the bubble
- The fifth argument edgecolors defines edge color of bubble as black
# use the scatter function
plt.scatter(x, y, s=z*100, alpha=0.5,edgecolors='black')
Show Area Chart
Using Matplotlib show() function to show the graphical view of area chart.
plt.show()
Python Bubble Plot Code
Use below entire bubble plot in python code using Matplotlib library and seaborn as dataset input.
# lmport Libraries

import matplotlib.pyplot as plt
import seaborn as sns

# Load seaborn iris dataset
df=sns.load_dataset('iris')

# Creaet Dataset

x=df['sepal_width']
y=df['sepal_length']
z=df['petal_length']

# use the scatter function
plt.scatter(x, y, s=z*100, alpha=0.5,edgecolors='black')
plt.show()
Bubble Plot Output

Cool Tip: Learn Basic Area Plot in Python !
Bubble plot in Python using numpy library input
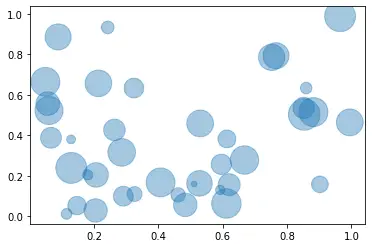
Let’s see an example to plot bubble chart with matplotlib scatter() function using random values generated by random function of numpy library.
Installation of Packages
We will require numpy and matplotlib packages installed on our system to draw bubble plot. If we don’t have packages installed, we can install packages with the command below.
pip install numpy
pip install matplotlib
Import libraries
We will import numpy and matplotlib libraries to plot area plot. We have imported the numpy library as np and matplotlib.pyplot library as plt to reduce the complexity of code.
import numpy as np
import matplotlib.pyplot as plt
Prepare dataset
Use random function of numpy library to create random input values
- x variable stores 40 random values
- y variable stores 40 random values
- z variable stores 40 random values
# Create Dataset
x = np.random.rand(40)
y = np.random.rand(40)
z = np.random.rand(40)
Cool Tip: Learn Customized Area Plot in Python !
Plot Bubble chart using scatter() function
Using matplotlib scatter() function to plot bubble chart
- The first argument x defines the x values for chart
- The second argument y defines the y values for bubble chart
- The third argument s defines scatter plot with bubble size
- The fourth argument alpha defines transparency to the bubble
plt.scatter(x, y, s=z*1000, alpha=0.4)
Draw Bubble Chart
Using Matplotlib show() function to show the graphical view of bubble chart.
plt.show()
Bubble Plot Python Code
Use below bubble plot in python matplotlib source code
# Import libraries
import matplotlib.pyplot as plt
import numpy as np

# Create Dataset
x = np.random.rand(40)
y = np.random.rand(40)
z = np.random.rand(40)

# use the scatter function
plt.scatter(x, y, s=z*1000, alpha=0.4)
plt.show()
Bubble Chart output

Cool Tip: Learn Stacked Area Plot in Python !
Customized Bubble Plot in Python
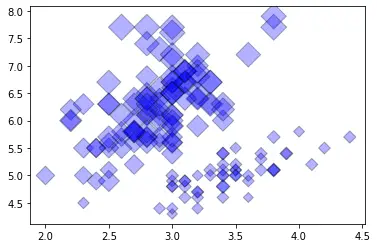
In this example, I will explain you to customize bubble chart in python like linewidth, change bubble shape with marker.
Installation of Packages
Follow above givens steps to install required packages and import libraries to get started with plotting bubble chart in python.
# Import libraries
import matplotlib.pyplot as plt
import seaborn as sns
Prepare Dataset
- Load seaborn library iris dataset in dataframe
- x variable stores sepal_width column values
- y variable stores sepal_length column values
- z variable stores petal_length column values
 # Load seaborn iris dataset
df=sns.load_dataset('iris')

# Prepare data
x=df['sepal_width']
y=df['sepal_length']
z=df['petal_length']
Plot Bubble Chart in Python
Use scatter() function of matplotlib module to plot bubble chart.
- The first argument x defines the x values for chart
- The second argument y defines the y values for bubble chart
- The third argument s defines scatter plot with bubble size
- The fourth argument marker =’D’ used to change shape of bubble
- The fifth argument alpha defines transparency to the bubble
- The sixth argument c defines bubble filled color
- The seventh argument edgecolors =’k’ defines black color as bubble border color
- The eighth argument linewidth defines line width
# Use the scatter function to map color and change shape of bubble with marker
plt.scatter(x, y, s=z*50, marker="D", alpha=0.3,c='blue' ,edgecolors='k', linewidth=1)
Show Bubble Plot
Using Matplotlib show() function to show the graphical view of bubble chart.
plt.show()
Bubble Plot Python Code
Use below bubble plot in python matplotlib source code
# Import libraries
import matplotlib.pyplot as plt
import seaborn as sns

# Load dataset
df=sns.load_dataset('iris')

# Prepare data
x=df['sepal_width']
y=df['sepal_length']
z=df['petal_length']

# use the scatter function to map color
plt.scatter(x, y, s=z*50, marker="D", alpha=0.3,c='blue' ,edgecolors='k', linewidth=1)
plt.show()
Bubble Chart output

Conclusion
I hope you found above article on bubble chart in python using matplotlib package informative and educational.
Use scatter() function of matplotlib library to plot bubble chart with size and edgecolors.