What is Parallel Plot?
Parallel coordinates plot are commonly used to visualization of high dimensional datasets. There are two ways to plot parallel coordinates plot in python using Pandas and using Plotly interactive visualization library for parallel coordinates plot in python.
In this article, I will explain you about how to plot parallel coordinates plot in python using Pandas library.
Installation of Packages
We will need numpy, matplotlib and Pandas packages to draw parallel coordinates plot in python. If you don’t have these packages installed on your system, install it using below commands.
pip install numpy
pip install matplotlib
import seaborn as sns
Parallel Coordinate Plot in Python
Let’s see an example to plot parallel coordinate chart using Pandas library. Pandas parallel_coordinates() function is used to plot parallel graph in python.
Import libraries
Import numpy, matplotlib, seaborn and pandas libraries in our python code to get started with plotting parallel chart in python.
import pandas
import matplotlib.pyplot as plt
from pandas.plotting import parallel_coordinates
import seaborn as sns
Cool Tip: Learn How to plot basic area plot in python !
Prepare dataset
Seaborn have inbuilt datasets. we have loaded iris dataset from seaborn using load_dataset function of seaborn.
We have stored dataset in variable data. We will plot the parallel plot for species.
data = sns.load_dataset('iris')
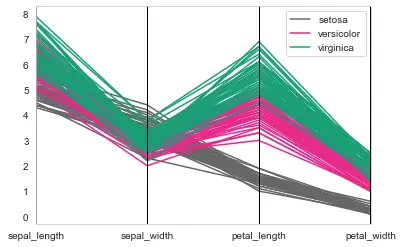
parallel_coordinates(data, 'species', colormap=plt.get_cmap("Dark2_r"))
In the above code, we have used Pandas parallel_coordinates function to create parallel coordinate plot. We passed the data variable ,species for plot. We have mapped the color of the graph using the colormap parameter of matplotlib.pyplot.
Show Parallel Coordinate Plot
Using show() function to get graphical representation of plot.
plt.show()
Cool Tip: Learn How to plot bubble chart in python !
Parallel Coordinates Plot in Python using Pandas Output

Conclusion
I hope you found above article to plot parallel coordinates plot in python using Pandas library. We can customize parallel plot using different parameters. Parallel coordinates plot needs numeric values only, so check dataset once for avoiding further errors.