What is Pie Plot?
Pie chart is the type of chart having circle divided into parts or sectors and all the sectors represent ratio of values plotted. To plot pie chart in python, use plot() function of pandas library.
In this article, I will explain how to plot pie chart in python using pandas package and subplot pie charts in python.
Installation of Packages
We will need pandas packages to create pie chart in python. If you don’t have these packages installed on your system, install it using below commands.
pip install pandas
How to Plot Pie Chart in Python
Let’s see an example to plot pie chart using pandas library dataset as input to chart
Installation of Packages
We will need pandas packages to show pie plot. Install packages using below command.
pip install pandas
Import libraries
Import pandas libraries in our python pie plot code to get started with plotting pie graph.
import pandas as pd
Prepare dataset
Create a dataset using pandas DataFrame() function to plot chart in python.
- The first argument defines list of the values
- The second argument defines list of the index
- The third argument defines columns, we have assigned column x
# Create Dataset for Pie Chart
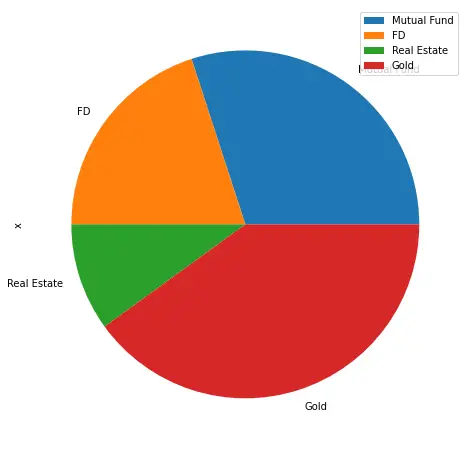
df = pd.DataFrame([30,20,10,40], index=['Mutual Fund', 'FD', 'Real Estate', 'Gold'], columns=['x'])
Draw Pie chart using Plot()
Use df.plot() function of pandas module to draw pie plot.
- The first argument kind defines pie chart type
- The second argument subplots as true
- The third argument figsize as (8,8)
# use the scatter function
df.plot(kind='pie', subplots=True, figsize=(8, 8))
Python Pie Plot Code
Use below entire pie plot in python code using pandas library
# Import library
import pandas as pd

# Create Dataset
df = pd.DataFrame([30,20,10,40], index=['Mutual Fund', 'FD', 'Real Estate', 'Gold'], columns=['x'])

# Make the Pie plot
df.plot(kind='pie', subplots=True, figsize=(8, 8))
Pie Chart Output

Cool Tip: Learn How to plot basic area plot in python !
Subplot Pie Chart using Pandas Python
Let’s see an example to plot subplot pie chart with pandas package.
Installation of Packages
We will require pandas packages installed on our system to draw pie plot. If we don’t have packages installed, we can install packages with the command below.
pip install pandas
Import libraries
We will import pandas libraries to plot area plot. We have imported the pandas library as pd to reduce the complexity of code.
import numpy as np
import matplotlib.pyplot as plt
Prepare dataset
Use dataframe function in pandas to create dataset.
- The first argument defines values to be stored in dictionary and assigned it to variable var1
- The second argument defines values to be stored in dictionary and assigned it to variable var2
- The third argument defines index to be stored in dictionary
- Construct dataframe from dictionary and assigned it to df
# Create Dataset
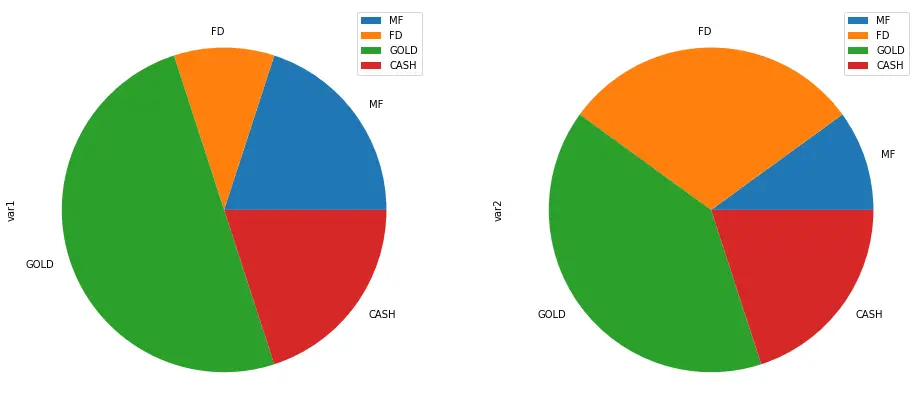
df = pd.DataFrame({'var1':[20,10,50,20], 'var2':[10,30,40,20]}, index=['MF', 'FD', 'GOLD', 'CASH'] )
Plot Pie chart using Plot() function
Use df.plot() function of pandas module to draw pie plot.
- The first argument kind defines pie chart type
- The second argument subplots as true
- The third argument figsize as (16,8)
df.plot(kind='pie', subplots=True, figsize=(16,8))
Pie Chart Python Code
Use below pie plot in python matplotlib source code
# Import library
import pandas as pd

# Create Dataset
df = pd.DataFrame({'var1':[20,10,50,20], 'var2':[10,30,40,20]}, index=['MF', 'FD', 'GOLD', 'CASH'] )

# Make the multiple plot
df.plot(kind='pie', subplots=True, figsize=(16,8))
Multiple Pie Chart output

Cool Tip: Learn How to plot stacked area plot in python !
Pie Chart in Python using matplotlib
In this matplotlib pie chart with python example, I will explain you to customize pie chart in python by changing the colors and appearance of the sectors.
To plot pie chart in python, use plt.pie() function of matplotlib library.
Installation of Packages
Follow above givens steps to install required packages and import libraries to get started with plotting pie chart in python.
# Import libraries
import matplotlib.pyplot as plt
Prepare Dataset
We will create pie chart for market shares of company
- firms variable stores list of companies
- market_share stores list of company market share
 # Create dataset
firms=['Apple','Facebook','Microsoft','Google','Tesla']
market_share=[25,20,20,25,10]
Plot Pie Chart in Python
Use scatter() function of matplotlib module to plot pie chart.
- The first argument define market_share
- The second argument define labels used on Pie chart
- The third argument s defines shadow as true
- The fourth argument define startangle as 90
- The fifth argument define colors used for firms
- Assign figsize(15,8) to change the size
plt.pie(market_share,labels=firms,shadow=True,startangle=90, colors=['black', 'yellow', 'blue','gray', 'red'])
plt.figure(figsize=(15,8))
Legend in Pie Chart
Set title and legend location for pie chart
plt.legend(title='list of Companies',loc=4)
Show Pie Chart
Using Matplotlib show() function to show the graphical view of pie chart.
plt.show()
Pie Chart Python Code
Use below pie plot in python matplotlib source code
# Import library
import matplotlib.pyplot as plt

 # Create dataset
firms=['Apple','Facebook','Microsoft','Google','Tesla']
market_share=[25,20,20,25,10]

plt.figure(figsize=(15,8))

#plot pie chart and set legend
plt.pie(market_share,labels=firms,shadow=True,startangle=90, colors=['green', 'yellow', 'blue','purple', 'red'])

plt.legend(title='list of Companies',loc=1)
plt.show()
Pie Chart output

Cool Tip: Learn How to plot bubble chart in python !
Customized Pie Chart Appearance in Python
In this matplotlib pie chart with python example, I will explain you to customize pie chart appearance of the sectors.
Installation of Packages
Follow above givens steps to install required packages and import libraries to get started with plotting pie chart in python.
# Import libraries
import matplotlib.pyplot as plt
Prepare Dataset
We will create pie chart for market shares of company
- firms variable stores list of companies
- market_share stores list of company market share
 # Create dataset
firms=['Apple','Facebook','Microsoft','Google','Tesla']
market_share=[25,20,20,25,10]
Plot Pie Chart in Python
Use pie() function of matplotlib module to plot pie chart.
- The first argument defines market_share
- The second argument defines labels used on Pie chart
- The third argument defines explode values
- The fourth argument defines shadow as true
- The fifth argument defines startangle as 90
plt.pie(market_share,labels=firms,explode=ex,shadow=True,startangle=90)
plt.legend(title='list of Companies',loc=4)
Legend in Pie Chart
Set title and legend location for pie chart
plt.legend(title='list of Companies',loc=4)
Show Pie Chart
Using Matplotlib show() function to show the graphical view of pie chart.
plt.show()
Pie Chart Python Code
Use below pie plot in python matplotlib source code
#import library
import matplotlib.pyplot as plt

 # Create dataset
firms=['Apple','Facebook','Microsoft','Google','Tesla']
market_share=[25,20,20,25,10]

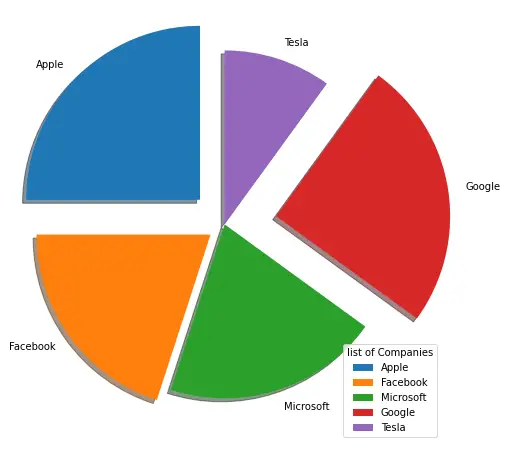
ex=[0.2,0.1,0,0.3,0]
plt.figure(figsize=(15,8))

#plot pie plot and set legend
plt.pie(market_share,labels=firms,explode=ex,shadow=True,startangle=90)
plt.legend(title='list of Companies',loc=4)
plt.show()
Pie Chart output

Cool Tip: Learn How to plot customize area plot in python !
Conclusion
I hope you found above article on Pie chart in python using pandas and matplotlib package informative and educational.
Use df.plot() function of pandas module to create pie chart with different size and mutiple pie chart.
Use plt.pie() function of matplotlib library to plot pie chart with legends, labels and appearance for the sectors.