Autocorrelation measures the degree of same variable correlation in time series and lagged version of the value of a variable.
Autocorrelation also referred as serial correlation or lagged correlation. It find how much lagged version of the value of a variable relationship with the current value of variable in time series.
Autocorrelation can be either positive or negative. It has value ranges in -1 to 1. Value near to -1 represents perfect negative autocorrelation and value near to 1 represents perfect autocorrelation in positive direction.
The Dublin-Watson statistic is used to test autocorrelation. The value of autocorrelation ranges from 0 to 4 for Dublin-Watson tests. If the value near to 0 represents stronger positive autocorrelation, and value near to 4 represents negative autocorrelation. If the value near to 2, it means less autocorrelation.
In this tutorial, we will discuss about how to calculate autocorrelation in python with step by step examples.
We will need to import statsmodel library and numpy package to calculate autocorrelation in python and matplotlib library to visualize data on chart.
pip install numpy
If you don’t have numpy package installed on your system, use below command in command prompt
pip install numpy
pip install statsmodels
statsmodels in python provides many classes and functions to conduct different statistical tests, estimate statistical models.
We will be using statsmodels api and graphics for calculation of autocorrelation and show positive and negative autocorrelation for given time series on graphics.
pip install statsmodels
pip install matplotlib
We will be using matplotlib library to visualize autocorrelation data.
pip install matplotlib
How to Calculate Autocorrelation in Python
Lets understand autocorrelation calculation with the help of examples.
Lets assume, we have temperature on different days of months, we will find out positive autocorrelation and negative autocorrelation.
temps = [68.2,65.6,67.2,67.8,66.1,66.5,68.2,67.8,68.4,68.6,68.3,69,68.7,68.9,69,69.5,69.7]
Using below python code, we will find autocorrelation and for lags = 10
import statsmodels.api as spi
import numpy as np
import matplotlib.pyplot as plt
from  statsmodels.graphics import tsaplots

#Create temperature data array

temps = np.array([68.2,65.6,67.2,67.8,66.1,66.5,68.2,67.8,68.4,68.6,68.3,69,68.7,68.9,69,69.5,69.7])

# Calculate Autocorrelations

res = spi.tsa.acf(temps,nlags = 10,fft = False)

# Print Autocorrelations lag = 10 observation
print(res)

# Plot Autocorrelation observation on chart
acr = tsaplots.plot_acf(temps,lags = 10)

plt.show()
In the above example, we have 17 days of temperature data as below
temp = [68.2,65.6,67.2,67.8,66.1,66.5,68.2,67.8,68.4,68.6,68.3,69,68.7,68.9,69,69.5,69.7]
We have used numpy package array function to create 17 days temperature array.
We have imported statsmodels.api library, which provide tsa.acf() function to calcualte autocorrelation.
tsa.acf() function takes parameters as temperature time series data, lags. We have specified lags = 10 to get number of lags.
It returns the output as array
[ 1. 0.53602483 0.35338064 0.47522452 0.23967742 0.03610916 -0.01787539 -0.14130361 -0.18734858 -0.22611561 -0.323244 ]
Based on output, we can interpret it as below
- The autocorrelation at lag = 0 is 1
- The autocorrelation at lag = 1 is 0.53602483
- The autocorrelation at lag = 2 is 0.35338064
and like this for rest of the lags till 10.
Plot Autocorrelation in Python
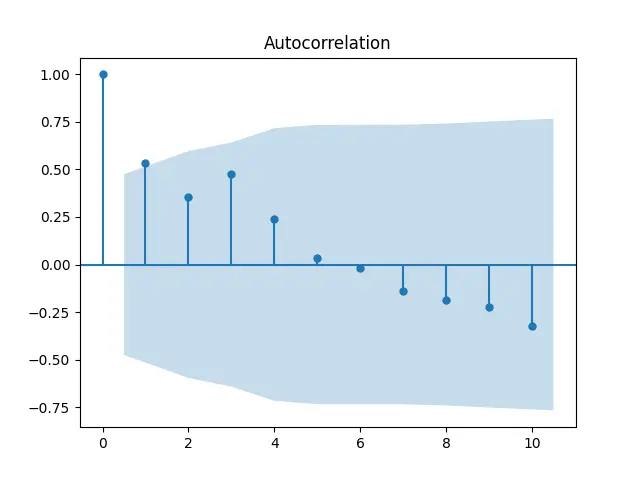
We have imported statsmodels.graphics library which provides tsaplots.plot_acf() function to plot autocorrelation function for a given temperature time series.
In the above example,
we have used, acr = tsaplots.plot_acf(temps,lags = 10) to plot autocorrelation observation for lag 10 on charts.

On chart, it can be easily visualize to determine how the temperature in given days of months are autocorrelated. Autocorrelation is ranges in between -1 to 1. On X axis, it displays number of lags and on Y axis, it displays autocorrelation for lag.
If the temperature in days are increasing, it may tends to increase next day and similar when temperature decreases, it tends to decrease in next day.
Conclusion
I hope, you may have like above tutorial on how to calculate autocorrelation in python educational and helpful.