The Shapiro-Wilk test is used to calculate whether a random sample of data comes from a normal distribution which is a common assumption used in many statistical tests including regression, ANOVA, t-test, etc.
Shapiro-Wilk test was proposed in 1965 by Samuel Sanford Shapiro and Martin Wilk.
It is believed to be a reliable statistical test of normality.
In this article, we will discuss how to perform a Shapiro-Wilk test in python with different examples.
Scipy for Shapiro-Wilk test
We will be using scipy library available in python to perform Shapiro-Wilk test.
If you don’t have scipy package installed then use below command on windows command prompt for scipy library installation.
pip install scipy
How to Perform Shapiro-Wilk test in Python?
scipy library provide scipy.stats.shapiro() function to perform Shapiro-Wilk test.
scipy.stats.shapiro(x)
where:
x : an array list containing sample data.
This function returns a test statistic and a corresponding p-value. We will determine the result by using the below decision rule.
Decision Rule:-
- If the p-value ≤ α, then we reject the null hypothesis i.e. we assume the distribution of our variable is not normal/gaussian.
- If the p-value > α, then we fail to reject the null hypothesis i.e. we assume the distribution of our variable is normal/gaussian.
where α is a significance level.
Let’s discuss the examples to perform Shapiro-Wilk test in python.
Example 1: Shapiro-Wilk Test on Normal Data
In this example, we will generate a random normally distributed data set and perform this test to understand functionality by using the below python code.
#import modules
import numpy as np
from scipy.stats import shapiro

# Using seed function to generate the same random number every time with the given seed value
np.random.seed(0)

#generate sample of 150 values that follow a normal distribution with mean =0 and standard deviation=1
mean1 = 0
sd1 = 1

data = np.random.normal(mean1,sd1,150)

#perform Shapiro-Wilk test
stat,p = shapiro(data)

print("The Test-Statistic and p-value are as follows:\nTest-Statistic = %.3f , p-value = %.3f"%(stat,p))
In the above code, first we import numpy package to use random.randint() function to generate a normally distributed array.
From scipy library shapiro() function is used to perform the Shapiro-Wilk test on data. It returns the test-statistic and corresponding p-value.
Here assume significance level is 0.05 (i.e. 95% confidence intervel)
The output of the above code is shown as below
The Test-Statistic and p-value are as follows:
Test-Statistic = 0.990 , p-value = 0.345
Since p-value = 0.345 is greater than 0.05, then we fail to reject the null hypothesis i.e. we do not have sufficient evidence to say that sample does not come from a normal distribution.
This is already known to us as we generated the normally distributed sample using normal() function from numpy library.
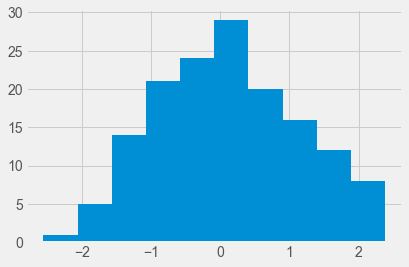
Now , let’s take a look at a visual representation for the above dataset using following code.
#import modules
import numpy as np
from scipy.stats import shapiro
import matplotlib.pyplot as plt

# Using seed function to generate the same random number every time with the given seed value
np.random.seed(0)

#generate sample of 150 values that follow a normal distribution with mean =0 and standard deviation=1
mean1 = 0
sd1 = 1
data = np.random.normal(mean1,sd1,150)

#plot the histogram
count, bins, ignored = plt.hist(data, 10)
plt.show()
We are using matplotlib package in order to visually represent the histogram for the dataset.
matplotlib.pyplot the package is used to plot the histogram to visualize data for generated data values.
We used hist() function to display histogram of the samples data values.

The histogram also shows that the distribution is fairly bell-shaped with one peak in the center of the distribution, which is typical of data that is normally distributed.
Example 2: Shapiro-Wilk Test on Non-Normal Data
In this example, we will generate a random sample dataset from the Poisson distribution and perform test by using the below python code.
#import modules
import numpy as np
from scipy.stats import shapiro

# Using seed function to generate the same random number every time with the given seed value
np.random.seed(1)

#generate sample of 100 values that follow a Poisson Distribution with mean =6
mean1 = 6

data = np.random.poisson(mean1,100)

#perform Shapiro-Wilk test
stat,p = shapiro(data)

print("The Test-Statistic and p-value are as follows:\nTest-Statistic = %.3f , p-value = %.3f"%(stat,p))
In the above code, we import numpy package to use random.poisson() function to generate a Poisson distributed dataset.
From scipy library shapiro() function is used to perform the Shapiro-Wilk test on data. It returns the test-statistic and corresponding p-value.
Here assume significance level is 0.05 (i.e. 95% confidence intervel)
The output of the above code is shown as below
The Test-Statistic and p-value are as follows:
Test-Statistic = 0.971 , p-value = 0.026
Since p-value = 0.026 is less than 0.05, then we reject the null hypothesis i.e. we have sufficient evidence to say that sample does not come from a normal distribution.
This is already known to us as we generated the sample from Poisson Distribution using poisson() function from numpy library.
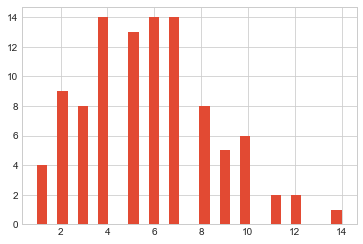
Now, let’s take a look at a visual representation for the above dataset using the following code.
#import modules
import numpy as np
from scipy.stats import shapiro
import matplotlib.pyplot as plt

# Using seed function to generate the same random number every time with the given seed value
np.random.seed(1)

#generate sample of 100 values that follow a Poisson Distribution with mean =6
mean1 = 6

data = np.random.poisson(mean1,100)

#plot the histogram
count, bins, ignored = plt.hist(data, 30)
plt.show()
We are using matplotlib package in order to visually represent the histogram for the dataset.
matplotlib.pyplot the package is used to plot the histogram to visualize data for generated data values.
We used hist() function to display histogram of the samples data values.

The histogram also shows that the distribution is not fairly bell-shaped.
It is right-skewed. This histogram also agrees with the results of the Shapiro-Wilk test and confirms sample data does not come from a normal distribution.
Conclusion
I hope, you may find how to perform a shapiro-wilk test in python tutorial with step by step illustration of examples educational and helpful.