The normal distribution is continuous probability distribution for real values random variables whose distributions are not known.
It is one of the important distribution in statistics. Normal distribution is mostly used in social sciences or natural. Normal distribution also known as Gaussian distribution.
A normal distribution is informally called as bell curve.
In this article, we will discuss about how to generate normal distribution in python.
Normal Distribution Definition
A continuous random variable X is said have normal distribution with parameter μ and σ if its probability density function of normal distribution is given by :
{ 1/[ σ * sqrt(2π) ] } * e-(x - μ)2/2σ2
Where,
X = random variable
μ = mean
σ = standard deviation
π = 3.14159
e = 2.711828
We will be using numpy.random.normal() function available to generate normal distribution.
pip install numpy
If you don’t have numpy package installed on your system, installed it using below commands on window system
pip install numpy
How to generate a normal distribution
Lets discuss with example to generate normal distribution in python
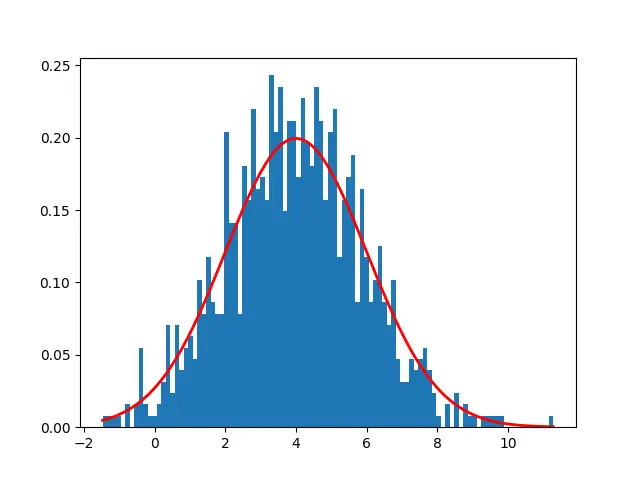
Lets generate a normal distribution mean = 4 and standard deviation = 2 and sample data of 1000 values
import matplotlib.pyplot as plt
import numpy as np

#generate sample of 1000 values that follow a normal distribution
mean1 = 4
sd1 = 2

data = np.random.normal(mean1,sd1,1000)
print(data[0:10])

# Create the bins and histogram

count, bins, ignored = plt.hist(data,100,density = True)

# Plot the distribution curve

plt.plot(bins, 1/(sd1 * np.sqrt(2 * np.pi)) *
         np.exp( - (bins - mean1)**2 / (2 * sd1 **2)),
         linewidth =2, color='r')
plt.show()
In the above code, first we import numpy package to use normal() function to generate normal distribution.
matplotlib.pyplot package is used to plot histogram to visualize data for generated normal distribution data values.
using data[0:10], it prints first 10 rows of data values.
To visualize distribution data values, we use hist() function to display histogram of the samples data values along with probability density function
Output of above program:
[1.54628665 3.72593179 3.38133163 4.20755645 4.02369098 5.07467887
 4.247651   3.58789491 2.65753858 6.40072075]
It display first 10 rows of data using data[0:10] and generate histogram plot.

In the above chart, X axis represents random variable, Y axis represent probability of each value, tip of the bell curve is 4 which is mean value.
Example -1 Generate Normal Distribution
Lets generate a normal distribution mean (μ) = 0 and standard deviation (σ) = 1 and sample data of 1000 values
import matplotlib.pyplot as plt
import numpy as np

#generate sample of 3000 values that follow a normal distribution
mean1 = 0
sd1 = 1

data = np.random.normal(mean1,sd1,1000)
print(data[0:10])

# Create the bins and histogram

count, bins, ignored = plt.hist(data,100,density = True)

# Plot the distribution curve

plt.plot(bins, 1/(sd1 * np.sqrt(2 * np.pi)) *
         np.exp( - (bins - mean1)**2 / (2 * sd1 **2)),
         linewidth =2, color='r')
plt.show()
In the above python code to generate normal distribution, we assume mean = 0 and standard deviation = 1, its a specific case and also called as Standard Normal Distribution.
Output of the above python code as below, we have used print(data[0:10]) to print first 10 rows of distribution data.
[ 0.33311452 -0.33228062  0.62564664 -0.64942493  0.91572608 -0.78839538
  0.79935677  0.5185406  -0.06801718 -1.61588657]
To visualize distribution data values, we have used hist() function which plot chart as below

In the above chart, X axis represents random variable, Y axis represent probability of each value, tip of the bell curve is 0 which is mean value.
Conclusion
I hope you may have liked above article about how to generate normal distribution in python with step by step guide and with illustrative examples.