Covariance measures the simultaneous variability between the two variables. It is very useful way to understand how different variables are related.
A positive value of covariance indicates that the two variables move in the same direction, whereas a negative value of covariance indicates that the two variables move on the opposite direction.
In this article, we will discuss about how to create a covariance matrix in python.
Numpy for Covariance Matrix
We will be using numpy library available in python to create covariance matrix
If you don’t have numpy library installed then use the below command on windows command prompt for numpy library installation
pip install numpy
How to Create a Covariance Matrix in Python
In python, Numpy library provide numpy.cov() function to create covariance matrix.
cov() a function that returns a matrix of covariance.
Let’s understand how to create a population covariance matrix in python with the given below code.
# import modules
import numpy as np

#define data
A = [15,17,12,15,19]
B = [18,11,16,18,13]
C = [20,25,17,11,12]

# create dataset
data = np.array([A,B,C])

#create covariance matrix
covMatrix = np.cov(data,bias=True)  # bias = True ,to get the population covarince matrix based on N.

#print covariance matrix
print('Covariance Matrix:\n',covMatrix)
In the above example, we create a dataset with A, B, C columns using numpy library.
To get the population covariance matrix (based on N)we had mentioned ,bias = True in cov() function.
The above python code returns below output:
#Output
Covariance Matrix:
 [[ 5.44 -3.92 -0.8 ]
  [-3.92  7.76 -6.2 ]
  [-0.8  -6.2  26.8 ]]
Interpret the Covariance:
The diagonals of the matrix represents the variances for each column with itself.
For example:
The variance of A is 5.44
The variance of B is 7.76
The variance of C is 26.8
The other values in matrix represents the covariance between the variables.
For example:
The covariance between A & B is -3.92
The covariance between A & C is -0.8
The covariance between B & C is -6.2
Now , let’s take a look at a visual representation of the covarince matrix for the above dataset using following code.
We are using seaborn and matplotlib packages in order to visually represent the covariance matrix.
# import modules
import numpy as np
import seaborn as sns
import matplotlib.pyplot as plt

#define data
A = [15,17,12,15,19]
B = [18,11,16,18,13]
C = [20,25,17,11,12]

# create dataset
data = np.array([A,B,C])

#create covariance matrix
covMatrix = np.cov(data,bias=True)

#print covariance matrix
print('Covariance Matrix:\n',covMatrix)

# plot heatmap for the covariance matrix
sns.heatmap(covMatrix, annot=True, fmt='g')
plt.show()

The plot shows the covariance between the variables. The darker color represents the negative covariance and the light color represents the positive covariance between the variables.
Example #1 How to Create a Covariance Matrix in Python
In this example, we will discuss how to create a sample covariance matrix in python with the given below code.
# import modules
import numpy as np

#define data
A = [15,17,12,15,19]
B = [18,11,16,18,13]
C = [20,25,17,11,12]

# create dataset
data = np.array([A,B,C])

#create covariance matrix
covMatrix = np.cov(data,bias=False)  # bias = False,to get the sample covarince matrix based on N.

#print covariance matrix
print('Covariance Matrix:\n',covMatrix)
In the above example, we considered the same dataset created in the last example.
To get the sample covariance matrix (based on N-1)we had mentioned ,bias = False in cov() function.
The above code returns below output:
#Output
Covariance Matrix:
 [[ 6.8  -4.9  -1.  ]
  [-4.9   9.7  -7.75]
  [-1.   -7.75 33.5 ]]
Interpret the Covariance:
The diagonals of the matrix represents the variances for each column with itself.
For example:
The variance of A is 6.8
The variance of B is 9.7
The variance of C is 33.5
The other values in the matrix represent the covariance between the variables.
For example:
The covariance between A & B is -4.9
The covariance between A & C is -1
The covariance between B & C is -7.75
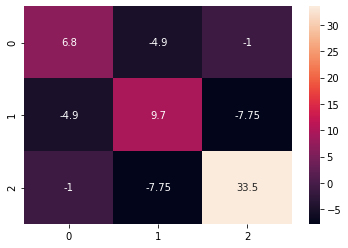
Now , let’s take a look at a visual representation of the covarince matrix for the above dataset using following code.
We are using seaborn and matplotlib packages in order to visually represent the covariance matrix.
# import modules
import numpy as np
import seaborn as sns
import matplotlib.pyplot as plt

#define data
A = [15,17,12,15,19]
B = [18,11,16,18,13]
C = [20,25,17,11,12]

# create dataset
data = np.array([A,B,C])

#create covariance matrix
covMatrix = np.cov(data,bias=False)

#print covariance matrix
print('Covariance Matrix:\n',covMatrix)

# plot heatmap for the covariance matrix
sns.heatmap(covMatrix, annot=True, fmt='g')
plt.show()

The plot shows the covariance between the variables. The darker color represents the negative covariance and the light color represents the positive covariance between the variables.
Let’s understand how to create a covariance matrix in python using some real world examples as given below
Example #2
A study was conducted to analyze the relationship between advertising expenditure and sales. The following data were recorded:
| Advertising (in $) | 20 | 24 | 30 | 32 | 35 |
|---|---|---|---|---|---|
| Sales (in $) | 310 | 340 | 400 | 420 | 490 |
Compute the covariance between advertising expenditure and sales.
Solution:
Let X represents the Advertising expense (in $)
Let Y represents the Sales (in $)
Based on above data, using cov() function, covariance matrix is calculated using below code:
# import modules
import numpy as np
import seaborn as sns
import matplotlib.pyplot as plt

#define data
X = [20,24,30,32,35]
Y = [310,340,400,420,490]

# create dataset
data = np.array([X,Y])

#create covariance matrix
covMatrix = np.cov(data,bias=False)

#print covariance matrix
print('Covariance Matrix:\n',covMatrix)

# plot heatmap for the covariance matrix
sns.heatmap(covMatrix, annot=True, fmt='g')
plt.show()
In the above code, using cov() function we calculates the covariance matrix.
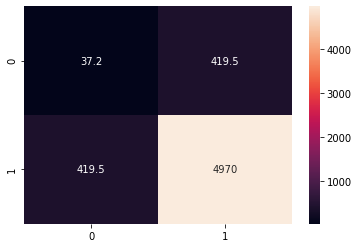
The covariance between advertising expenditure and sales is 419.5. Since the value of covariance is positive, this indicates that the increase in advertising expenditure tends to increase in sales.
#Output
Covariance Matrix:
 [[  37.2  419.5]
  [ 419.5 4970. ]]
The visual representation of the above covariance matrix is shown below.

Conclusion
I hope you find the above article on how to create a covariance matrix in python code useful and educational.