Correlation is a statistical technique that can show whether and how strongly pairs of variables are related. It measures the strength of linear association between two variables.
There are several types of correlation coefficients, but the most popular is Pearson’s correlation coefficient.
The sign and absolute value of Pearson’s correlation coefficient describe the direction and the magnitude of the relationship between two variables.
It always ranges from -1 to +1. where the greater the absolute value of a correlation, the stronger will be linear relationship.
In this tutorial, we will discuss about how to calculate Correlation in python.
pip install numpy
If you don’t have numpy package installed on your system, installed it using the below commands on the window system
pip install numpy
Example – Positive Correlation in Python
In python, Numpy library provides corrcoef() function to calculate the correlation between two variables.
corrcoef() a function that returns a matrix of correlations of x with x, x with y, y with x, and y with y. We’re interested in the values of correlation of x with y (so position (1, 0) or (0, 1)).
Let’s understand how to calculate the correlation between two variables with given below python code
#import modules
import numpy as np

# Using seed function to generate the same random number every time with the same seed value
np.random.seed(4)

# Create a random array of 500 integers between 0 and 50
x = np.random.randint(0, 50, 500)

# Create the second array using first array by adding some noise
y = x + np.random.normal(0, 10, 500)

correlation = np.corrcoef(x, y)
#print the result
print("The correlation between x and y is : \n ",correlation)
In the above example, we have created two x and y array using numpy library random function.
The numpy library corrcoef() function accepts x and y array as input parameters and returns correlation matrix of x and y as a result.
The above code returns below output:
//output
The correlation between x and y is :
 [[1.         0.82477049]
 [0.82477049 1.        ]]
The correlation coefficient between these two variables is 0.82477, which is a strong positive correlation.
By default, this function returns a matrix of correlation coefficients. If we only wanted to return the correlation coefficient between the two variables, we will use the following code.
print("The correlation coefficient between x and y is :",np.corrcoef(x,y)[0,1])
The above code returns below output:
//output
The correlation coefficient  between x and y is : 0.82477049
Now , let’s take a look at a scatter chart for the above array using following code.
import matplotlib
import matplotlib.pyplot as plt
%matplotlib inline
matplotlib.style.use('ggplot')

plt.scatter(x, y)
plt.show()

The plot also shows a strong positive correlation between the variables as they are in increasing mode.
Example – Negative Correlation in Python
Let’s understand another example of what happens to correlation if we invert the correlation such that an increase in x results in a decrease in y?
#import modules
import numpy as np

# Using seed function to generate the same random number every time with the same seed value
np.random.seed(5)

# Create a random array of 500 integers between 0 and 50
x = np.random.randint(0, 50, 500)

# Create the second array using first array by adding some noise
y = 100 - x + np.random.normal(0, 5, 500)

correlation = np.corrcoef(x,y)[0,1]
#print the result
print("The correlation between x and y is : \n ",correlation)
The above code returns below output:
//output
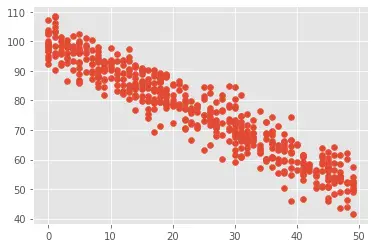
The correlation between x and y is :  -0.9483070198223033
The correlation coefficient between these two variables is -0.948307, which is a strong negative correlation.
Now , let’s take a look at a scatter chart for the above array by using the following code.
import matplotlib
import matplotlib.pyplot as plt
%matplotlib inline
matplotlib.style.use('ggplot')

plt.scatter(x, y)
plt.show()

The plot also shows the strong negative correlation between the variables as they are in decreasing mode.
Example – No Correlation in Python
Let’s understand another example of what if there is no correlation between x and y?
#import modules
import numpy as np

# Using seed function to generate the same random number every time with the same seed value
np.random.seed(1)

# Create a random array of 1000 integers between 0 and 50
x = np.random.randint(0, 50, 1000)

# Create the another random array of 500 integers between 0 and 50
y = np.random.randint(0, 50, 1000)

correlation = np.corrcoef(x,y)[0,1]
#print the result
print("The correlation between x and y is : \n ",correlation)
The above code returns below output:
//output
The correlation between x and y is :
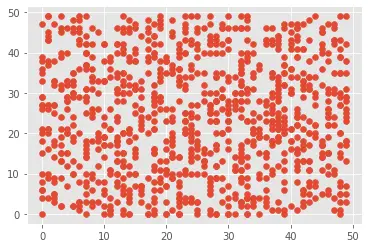
  0.004047024772834938
The correlation coefficient between these two variables is 0.00404, which is a very small value, indicating no correlation between these two variables.
Now , let’s take a look at a scatter chart for the above array using following code.
import matplotlib
import matplotlib.pyplot as plt
%matplotlib inline
matplotlib.style.use('ggplot')

plt.scatter(x, y)
plt.show()

The plot also shows there is no correlation between the variables.
Example – Find Correlation in Python Pandas
Let’s understand another example where we will calculate the correlation between several variables in a Pandas DataFrame.
For the dataframes in python,you can simply use the corr() function for the calculation of correlation.
#import modules
import numpy as np
import pandas as pd

# Using seed function to generate the same random number every time with the same seed value
np.random.seed(1)

# Create a random DataFrame with 3 columns(X,Y,Z) and 5 rows
data = pd.DataFrame(np.random.randint(0, 10, size=(5, 3)), columns=['X', 'Y', 'Z'])

#Print the data
print("The Dataframe is as follows:\n",data)

#calculate correlation coefficients for all pairwise combinations
correlation = data.corr()

print("The Calculated Correlation matrix is as follows:\n",correlation)
The numpy library corr() function returns correlation matrix of x and y as a result.
The above code returns below output:
//output
The Dataframe is as follows:
    X  Y  Z
0  5  8  9
1  5  0  0
2  1  7  6
3  9  2  4
4  5  2  4

The Calculated Correlation matrix is as follows:
         X         Y         Z
X  1.000000 -0.506110 -0.215166
Y -0.506110  1.000000  0.927807
Z -0.215166  0.927807  1.000000
If you want to calculate the correlation between two specific variables in the DataFrame, you can specify the variables like below
#Correlation between X and Y column
correlation_XY = data['X'].corr(data['Y'])

#Print the results
print("The Correlation between X and Y column is : ",correlation_XY)
In the above code, we calculate the correlation between the X and Y columns only. It returns the below result. The correlation coefficient between these two columns is -0.506110 which is a negative correlation.
//Output
The Correlation between X and Y column is :  -0.5061102063618225
Conclusion
I hope you find the above article on how to calculate Correlation in python code useful and educational.